eazyBI - Send your dashboard as PDF
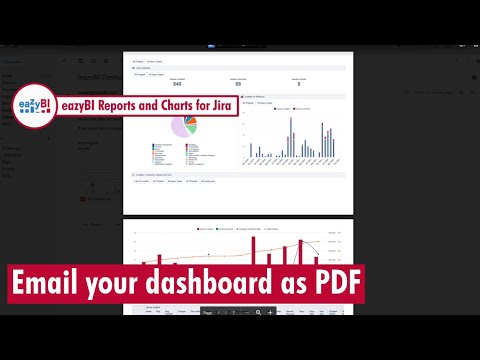
You can subscribe to your dashboard to receive an email with PDF
#eazyBI #PDF #Email
You can subscribe to your dashboard to receive an email with PDF
#eazyBI #PDF #Email
Let me answer some of your questions.
#GetAnswers #YourComments

When using JQL to filter issues based on selected labels the output would be a list of issues but when you create a gadget using let us say two dimensional filter statistics then other labels would also show up in the table. To create a customised report you would need to use an app like eazyBI.
#GetAnswers #Labels

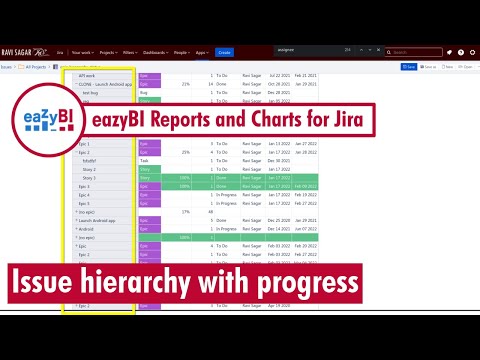
Do you want to create a report to visualise your hierarchy? It could be from your Advanced Roadmaps or just Jira Software Epics - Stories - Sub tasks with progress. It can be done easily.
#eazyBI #issuehierarchy
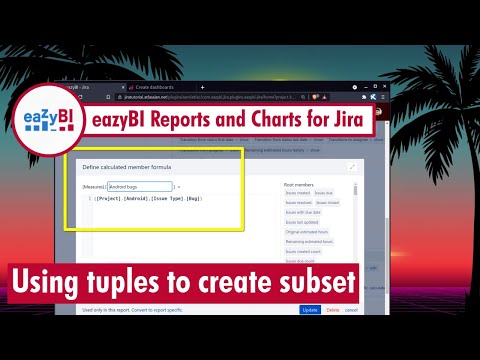
Having common page filters are great but what if you just want to create a report only on a subset. For instance only open bugs of Android project?
#eazyBI #Tuple #Subset
I was walking in the park today and thought of responding to some of your questions related to ScriptRunner, eazyBI reports from external data, Advanced Roadmaps, EasyAgile and Jira REST API.
#YourComments

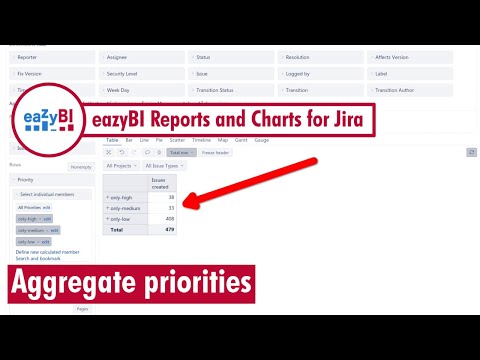
How would you combine various priorities or statuses together so that your overall report shows only few of them? Well you can use Aggregate using MDX custom calculation.
#eazyBI #aggregate
What are your options if your sales or non technical teams finds advanced roadmaps to advanced?
#GetAnswers #Roadmaps

Today I had the pleasure to talk to Asha Goyal, she is an experienced Jira Administrator with several years of experience. It was great to know that she also loves using ScriptRunner like me and enjoys working on Jira. We also discussed career opportunities in Atlassian domain and work life balance.
Asha Goyal: https://www.linkedin.com/in/asha-goyal-20a86050/

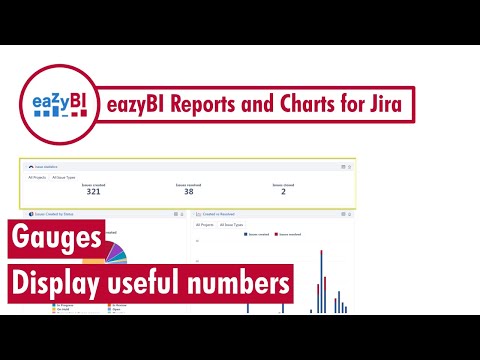
You can display useful numbers like outage, major incidents or number of open issues using gauges in your report.
#eazyBI #gauges
Free eazyBI course: https://www.ravisagar.in/courses/mastering-eazybi-reports

Ravi Sagar
ravi at sparxsys dot com
Author of "Mastering JIRA 7" book. Loves #Jira and #Drupal. #Blogger, #ProblemSolver, #Atlassian #Consultant and #Technologist @ravisagar on twitter
Want my help? raise a support request for me.
Social and other Links